Simulating Kicad schematics with Spice
I’ve been using Tina TI to do simulation of electronic circuits for a long time. Tina can be kind of frustrating though since it’s a GUI application so for almost as long I’ve had this idea about finding some other simulator that can be scripted in some way to run a batch of simulations where I can do variants of each simulation, maybe with different component values and with different stimuli. But most other simulators I’ve looked at such as qucs are just as “bad” in that they are hard to script.
Most of the things I want to be able to do can be done with one of the free spice simulators such as Ngspice, but the raw Spice language is kind of painful to use. It would be nice if I could just draw a schematic in Kicad and then export a netlist which can be used with Ngspice, but I have not been able to get that to work the way I want it to. The netlists lack some information that is present in the schematics that would be good to have in a simulation.
A few weeks ago I got so frustrated that I started writing my own parser which can read a Kicad schematic file and extract the components and connectivity from those. And for some strange reason I also wrote a renderer which can render the schematic using matplotlib as a backend. This turned out to have it’s advantages…
Today I finally put together the missing parts, a converter which translates the Kicad schematic (including any spice model directives) to a Ngspice compatible circuit, runs ngspice in batch mode and then retrieves all the resulting values from the rawfile that Ngspice outputs.
And it actually seems to work decently.
So here’s what I can do right now.
First I have to import the usual modules to use matplotlib and numpy:
import matplotlib.pyplot as plt
import numpy as np
I can then load a kicad schematic:
from kicad.sch import Sch
sch = Sch('../simulation/tia/tia.sch')
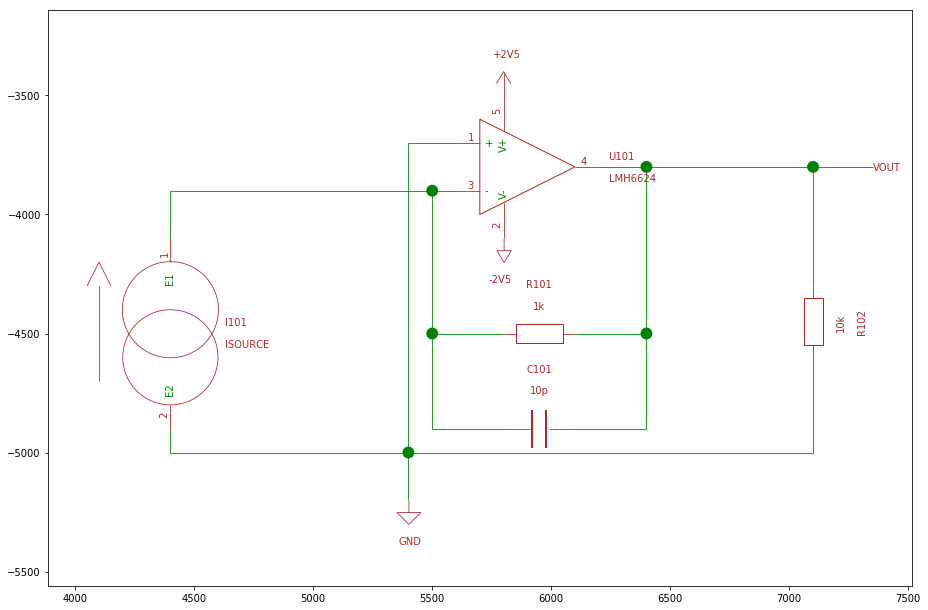
and render the kicad schematic in a matplotlib plot. This is a normal simple transimpedance amplifier using the spice model for a LMH6624 OP-amp:
from kicad.render_matplotlib import render_matplotlib
fig, ax = plt.subplots(figsize = (15, 10))
fig.subplots_adjust(left = 0.1, right = 0.9, top = 0.9, bottom = 0.1)
render_matplotlib(ax, sch)
ax.axis('equal')
plt.show()
I can then convert the Kicad schematic to a spice circuit:
from kicad.spice_converter import sch_to_spice
circuit = sch_to_spice(sch)
All I have to do then is start Ngspice:
from spice.ngspice import NgSpice
from spice.unit import *
spice = NgSpice()
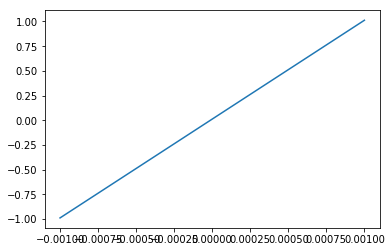
and run something simple such as a DC sweep and plot it:
data = spice.dc('hello world', circuit, 'i101', -1 * m, 1 * m, 1 * u)
plt.plot(data['v(i-sweep)'].values, data['v(vout)'].values)
plt.show()
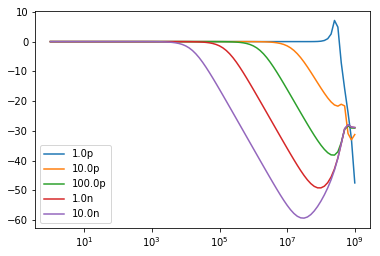
And here comes the fun part. I can now run multiple simulations, and then show them in one plot. For example this is an AC simulation where I plot the frequency response for multiple different values of capacitor C101:
values = [ 1 * p, 10 * p, 100 * p, 1 * n, 10 * n ]
for v in values:
    circuit.devices['C101'].value = v
    data = spice.ac('hello world', circuit, 'dec', 10, 1, 1 * G)
    plt.plot(data['frequency'].values.real,
             20 * np.log10(np.abs(data['v(vout)'].values)),
             label = str(v))
plt.xscale('log')
plt.legend()
plt.show()
Even nicer, since matplotlib has lots of backends this works just about anywhere, including the rendering of the schematics. I can run the above commands with Python on Linux and show the schematics and plots in a normal X window. And since matplotlib can produce beautiful plots in a bunch of different formats (PNG, SVG, PDF) I can generate nice plots in all of them.
Originally I played around with wxPython and displayed my matplotlib plots in an embedded frame. My idea was to write a GUI (yeah, yet another GUI) that would let me set up and arrange multiple simulations and plots in a Window. But then I realised that since matplotlib is supported in Jupyter and that the easiest way to play around with and test things is to just use an interactive notebook. A big part of this blog post was actually generated by Jupyter and translated to Markdown with jupyter-nbconvert.
And it really is simple and convenient. If I make a change in the Kicad schematics, I can just reload it and rerun all my simulations with one command. If I just want try out some component values I don’t even have to leave the notebook since I can easily change them with some code.
Of course, this is just a quick hack so far and the code to do all this is ugly as sin. It’s nowhere near complete either. I’ve only added support for the R, C, L, I and X devices so far, enough to verify that my first simple schematic can be simulated. Only AC and DC simulations work so far, but it should be trivial to add transient and noise simulations.
Even as incomplete as this all is, I must say that it feels really promising.